Creating & Using Graphics

I have always found it easier to understand concepts when there is a visual aspect to accompany a text, so learning about the theory of two separate channels just made sense to me. Providing students with both visual and auditory material creates more opportunities for them to process what they are learning. I think about the differences in the way I process information while reading a textbook featuring little to no visuals, compared to watching a Crash Course video. I often find myself losing meaning while reading through paragraphs and having to back-track to fully understand the text. Likewise, the colourful graphics that accompany Crash Course’s educational videos serve a great purpose. The fast-paced delivery of the content is matched with relevant, captivating graphics, making it easy to keep up with the lecture.

Using graphics to present your content to students can either make or break the way it is processed; this depends on how relevant your graphics are to the text. Relevancy is the most important aspect to keep in mind when choosing or designing graphics for your text. If you are presenting students with a text about WWII, accompanying that text with graphics of icecream cones or racecars will only cause confusion. The graphic needs to be relevant to the concept it is presented with, and should further clarify the text. Thinking about graphic-use this week reminded me of a history class I took last year. The professor would include rebuses in his slideshows everyday, adding a fun activity for the class to participate in, as well as provide a visual to connect concepts with.


I’ve been exploring different platforms to create graphics, trying to find the platform that works best for me. After trying out Vectr, Pixlr, and Canva, I decided Canva worked the best for my purposes. This platform has endless opportunities for creating graphics, and I haven’t found a project it can’t be used for. I used Canva to create the feature image of this blog post, as well as all the headers and visuals.
I will definitely be implementing graphics in my future teaching methods. I have found a passion for creating videos as well as other interactive content, and I am looking forward to bringing this into my classroom. I think it would be valuable to also start teaching students about designing graphics, as it may spark a future passion. I would also like to use rebuses, as I found they brought a really fun energy into the classroom.
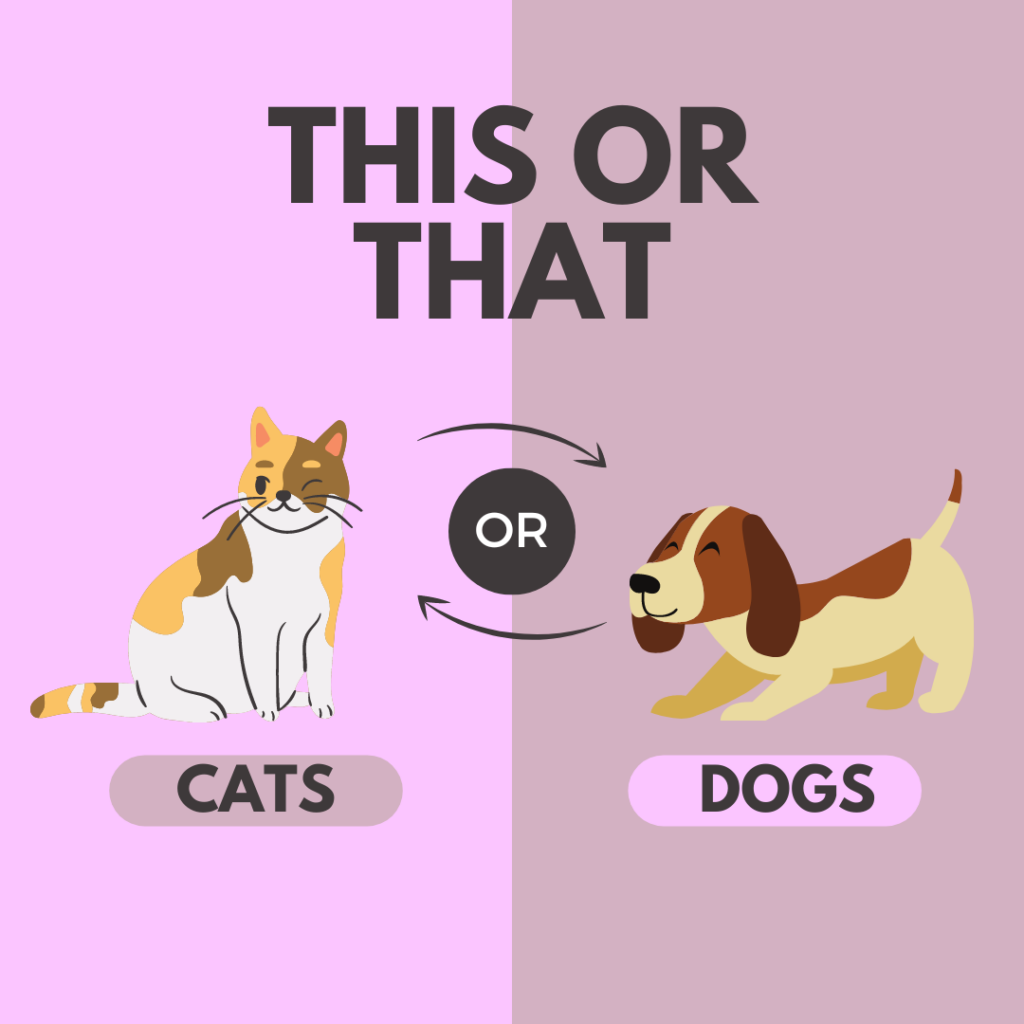
Using graphics is also just a really great way to get kids engaged. Once you’re comfortable creating graphics, it becomes pretty easy to quickly whip up a fun image for kids to interact with. I think this would be really great for daily check-ins, student surveys, or just a fun activity to help you get to know your students a little better!


Hey Alannah! I love the set up of your blog and all the graphics you’ve used. The set up of your blog makes it really easy to read and move through, it flows very well. The way it’s broken up and organized is awesome and just makes it very digestible. Great post and use of graphics to make your point!